Product management takeaways

I’ve just spent two days with two Jeffs (Gothelf and Patton). They ran a great product management course, and I wanted to quickly get down some of my personal takeaway points, while it’s fresh in my mind.

The term MVP has been wrecked

This rang true as one of my bugbears. I’ve always referred to the definition from Eric Ries’ 2011 book The Lean Startup:

The smallest thing you can make or do, to test a hypothesis

But I hadn’t realised the phrase was originally coined in 2001, by Frank Robinson, as:

The smallest product to meet it’s desired market outcomes

I can see why these clash, and how the wording of Ries’ definition causes confusion.

The term has become overloaded where I work, often being used to refer to:

The scope that’s left once we’ve fixed the people working on the team, and the timeframe they have available.

I’m aiming to use the two alternative terms that Jeff Patton suggested, to be more specific in referring to the Robinson or Ries definition, respectively:

Smallest Successful Release

Next Best Test

Defining metrics for impacts and outcomes

This is pretty much what we’ve been doing on our work around self-referral into psychological therapies; figuring out what the key impact is, quantifying that, and then defining measurable outcomes that are leading indicators of us achieving that impact. We’ll do more on visualising this.

Hypotheses are going to hang around

I’ve used hypotheses to track user research experiments and activities, but I think a mistake we’ve made is to think that a hypothesis is done with, either validated or not, after our first experiment.

It’s fine to run a succession of experiments against a given hypothesis, each experiment becoming higher fidelity, as we learn more (see Giff Constable’s Truth Curve).

A hypothesis likely won’t be completely proven until we get something into production at scale. The earlier, lower-fidelity experiments allow us to stop earlier if a hypothesis is disproven.

Visualising multiple backlogs

We’ve tried before to visualise the end-to-end flow of work, from idea through to delivered user stories, and ended up ditching it in favour of a much simpler ‘Todo, Doing, Done’ type of board, for the whole team.

Jeff Patton showed some examples of separate backlogs and boards, for different types of work. I think we should have another go at this, embrace the idea that there are different types of Discovery and Delivery work going on, and visualise accordingly.

This also ties in with the ideas around dual-track development, another thing we could get more rigorous with. There were some great ideas around adapting your ‘scrum’ sessions to play towards these two different types of work going on.

Three ways of prioritising, for three different situations

These different types of work, and separate backlogs, should be managed and prioritised in different ways too:

New opportunities identified should be prioritised against our overall strategy or vision, to ensure we engage with things that keep us heading in that direction.

For Discovery activities we should prioritise based on what we need to learn the most about; assessing hypotheses based on risk and potential value.

Once we, as Product Managers, have defined a minimum successful release, then the team need to prioritise the user stories in that release based on a different set of criteria, such as:

  • What are the risks around feasibility of delivering this story
  • What else is dependent on this story
  • How likely is this to break something else
  • How long do we need to test this story

The Product Manager probably isn’t the best person to make these more granular prioritisation calls. Engineering are more qualified to understand a lot of the criteria above, based on believability-weighted decision-making.

Better Collaboration

Lots of tips on better collaboration – less talking, more intuition, stricter time-boxing.

I’ve often tried to include the whole team (maybe 8-10 people) in decision-making, but Jeff Patton made a good case for running sessions with fewer people. He talked about teams having a mix of deciders and executors, and having a core trio of Product Manager, Design Lead, and Engineering Lead, to lead on making a lot of decisions.


The course was technically a Certified Scrum Product Owner course, but the time we spent on Scrum itself was mainly focused on ways in which we can adapt it.

The things listed above are those sticking in my mind right now, but there was heaps of other good stuff over the two days, and loads to apply right away.

I had to leave early, so thank you, Jeffs.


What’s in a name – Owner, Manager, or Leader?

My esteemed colleague @benjiportwin just wrote a parting post which talks about job titles, and how much they matter, if at all.

He opened with the the Product Owner vs. Product Manager job title thing, which I’ve also been thinking about.

When I joined the NHS Choices team a few years back we had Product Leads who each looked after a specific area of the service. They did a great job of defining the changes needed for their particular products, but didn’t always interact directly on a day-to-day basis with the people building those products.

Changing titles to indicate change

We spent a couple of years changing this as we implemented agile methods across the programme. At the time I pushed for these roles to be called Product Owners, mainly because I wanted to force a distinction between the old and the new way, and that’s what the methodologies we were adopting (like Scrum) tended to call that role.

Shared ownership rules

I tend to associate the Product Owner role title with Scrum, and over time have gone off it a bit. Partly because I don’t like the idea of sticking with just one fixed methodology, and partly because it could imply one person having sole ownership of the product. I much prefer the idea of a team collectively owning the product that they build and run together.

Industry-standard

Instead I shifted towards the Product Manager job title. This seems to be much more of an industry-standard these days. If I see a Product Owner job ad I think “they do Scrum”, when I see Product Manager I think “they have Product teams”. Generalisations I know, but that’s what it conjures up in my mind.

Full circle

Most recently I’ve come back around to Product Lead. I like the idea of somebody leading the development of a product, rather than managing it. I think we all know the difference between a manager and a leader.

Managing a product could perhaps be read as holding it back, pruning it, keeping it in check (thanks to @st3v3nhunt for this). Whereas leading it talks of setting a vision, inspiring progress, and taking the product forward to exciting new places!

Does it matter?

I’ve thought about this mainly because I’ve been taking on a product role myself, but really, as Benji said in his post;

job titles are interchangeable and frankly unimportant, but what matters is the impact you make each and every day.

Good luck in NYC, Benji. See you on the sun deck!

My first User Research

Note – I originally posted this here on the NHS Choices blog back in February. It was written as three separate posts about User Research, from the point of view of someone who hasn’t been involved in this kind of thing before.


Over the last fortnight I’ve been observing User Research with my team, and it has been quite an eye-opener.

We’re at the point in our Discovery phase where we’ve made a bunch of assumptions about our users and their needs, and gathered information around these assumptions from various sources – on and off-site analytics, existing literature and research, social media, our service-desk tickets, and on-site surveys.

Now it’s time for us to talk directly to some USERS*

* Not all of the people we interview are necessarily users of the current NHS Choices service. Some of them might be potential users too.

User Research like this isn’t new to us. NHS Choices has had a dedicated Research team since 2007, but it’s in the last year or so that we’ve really started to more tightly integrate the work that the researchers do, into our delivery cycle. This is the first time we’ve involved the whole of the multi-disciplinary transformation team in observing and note-taking for the research sessions, doing the analysis and deciding on next steps within a couple of intensive research days.

Who do we interview?

For the two topics we’re focusing on right now – we’ve been talking to two distinct groups of people

  • Parents of children who’ve had Chickenpox in the last three months
  • People who sought a new Dentist in the last three months

We make sure we talk to a mixture of men and women from different socio-economic groups, of different ages, and with differing levels of internet skill.

We ask some quite detailed questions, so it’s good to get people who have had a relatively recent experience (hence the three month time-window) as the experiences they’re recalling will tend to be more accurate.

We use some dedicated participant recruitment agencies to source the specific people we want to interview. We supply a spec, like the parents described above, and they go and find a selection of those people. Obviously there’s a cost attached to this service, but the recruitment can be time-consuming, and it would be difficult to find a big enough cross-section of people ourselves.  Outsourcing this to an agency frees up our researchers to focus on the actual research itself.

The setup

We do some interviews in the participants’ own homes – interviewing people in their own environment gives us a much better sense of how people look for information and where this fits into their lives. Also we get to meet participants who would not want to go to a viewing facility.

We also do interviews in a dedicated research facility – these are the ones that the rest of the team and I have been observing.

We’ve used a couple of facilities so far, one in London, and SimpleUsability in Leeds – just a five minute walk from our Bridgewater Place office.

Our interviews have been one hour long. The participants sit with a researcher – who conducts the interview – and a note-taker in the interview room. The note-taker might be another researcher or other member of the team – we’ve had UX Architects and service desk analysts taking notes in our sessions.

With the participants, the researcher and the note-taker in the interview room, the rest of the team are behind a one-way mirror with the sound piped in, observing the whole show.

User Research Observation Room

And yes, with the one-way mirror, it fell to @seashaped and myself to make all the obligatory unfunny gags about being in a police interrogation scenario…

Interviewing

The interviews are based around a Topic Guide prepared beforehand by the researcher. This is based on input from our previous research, and includes specific subjects around which we want to learn more. The whole team feeds their ideas into the Topic Guide.

The interviews aren’t run strictly to the guide though – we’re talking to people about their lives, and the health of them and their families, so naturally the discussion can wander a little. But our researchers are great at steering the discussion such that we cover everything we need to in the interviews.

We decided not to put any prototypes in front of users in the first round of research. We’re trying to learn about users’ needs and their state of mind as they’re trying to fulfil those needs, so we didn’t want to bias them in any way by putting pre-formed ideas in front of them.

We did run a card-sorting exercise with users in the first round of Dental research – getting the participants to prioritise what would be most important to them when searching for a new dentist, by letting them sort cards.

We had a camera set up for the card-sorting exercise, so we could all see it clearly, without crowding around the mirror in the observation room.

Card Sorting

As the interview takes place, the note-taker is busy capturing all of the insights and information that come up. As the participant talks, the note-taker captures each individual piece of information or insight on a separate post-it note. This results in a lot of post-its – typically we’ve been getting through a standard pack of post-its per interview.

GDS have written in more detail about some note taking good practices.

Lots of post-its

Sorting into themes

Once the interviews are over, we have to make sense of everything the users have told us. We have a whole load of insights – each one logged on an individual post-it note. We need to get from what the users have said, to some actionable themes, as quickly as possible, without producing heavyweight research reports. We use the affinity-sorting technique to help us do this.

This basically involves us sorting all of the post-its into themes. We’ve been having a stab at identifying themes first, and then sorting the post-its into those groups first. As the sort takes place we’ll typically find that a theme needs to be split into one or more themes, or sometimes that a couple of existing themes are actually the same thing.

list of chickenpox themes

This isn’t the job of just the researcher and note taker who conducted the interviews. The whole team that’s been carrying out and observing the User Research takes part in this process, shifting post-its around on the wall until we feel we have some sensible groupings that represent the main themes that have come out of the interviews.

Dental Affinity Sorting

Chickenpox Affinity Sorting

Although we’re not presenting our research findings as big research reports or presentations, we are logging every insight electronically. After the sort, every insight gets logged in a spreadsheet with a code to represent the participant, the date and the theme under which the insight was grouped. We’re reviewing our approach to this, but the idea is that over time this forms our evidence base, and is a useful resource for looking back over past research, to find new insights.

Hypotheses

Once we have our themes we have to prioritise them and decide what to do with them next. At this early stage this usually means doing some more learning around some of the important themes. We’ve been forming Hypotheses from our Themes – I think this helps to highlight the fact that we’re at a learning stage, and we don’t know too much for sure, just yet.

We’ve been playing around with the format of these Hypotheses. As an example, one of the strong themes from our first round of User Research on Chickenpox was around visual identification. We expressed this as follows –

We believe that providing an improved method of visual identification of Chickenpox

for parents

will achieve an easier way for parents to successfully validate that their child has Chickenpox.

When testing this by showing a variety of visual and textual methods of identification to parents of children who’ve had chickenpox

we learned …

So we will

If you’re familiar with User Stories, you can see how this hypothesis would translate into that kind of format too. You could argue that all User Stories are Hypotheses really, until they’re built and tested in the wild.

Low-fidelity Prototypes

In order to test this hypothesis, we’re going to need some form of prototype to put in front of users. We’re working on a weekly cycle at present so we only have a few days before the next round of research. Speed of learning is more important at this stage, than how nice our prototypes look, so we’re just producing really low-fidelity prototypes and presenting them on paper.

For the visual identification hypothesis, here are some of the prototypes we’re presenting to users in our second round of research – see what I mean by low-fidelity, but this is just what we needed in order to explore the concepts a bit further, and learn a bit more.

Chickenpox prototype 1

Chickenpox prototype 2

We’ll base some of the questioning in our second round of research around these prototypes, and capture what we learn in our hypothesis template.

Based on this learning from the second round of research, we’ll either capture some user needs, write some new hypotheses to test, create some further prototypes to test, or maybe a mixture of all three.

Side effects

One interesting side-effect of our research sessions that we noticed was that some users were unaware of some aspects of our existing service, and as @kev_c_murray pointed out, some users left the sessions with an increased knowledge of what is available to them.

With comments like “Yeah I’m definitely going to go and look that up on your site now.” – we’re actually driving a little bit of behaviour change through the research itself. Okay, so if this was our behaviour-change strategy we’d have to do another 7 million days of research to reach the whole UK adult population, but every little helps, right…

What have we learned about how we do User Research?

  • The one week cycle of doing two full days of Research, then sorting and prototyping, is hard work. In fact it probably isn’t sustainable in the way we’re doing it right now, and we’ll need to adapt as we move into an Alpha phase.
  • Do a proper sound check at the start of the day – in both facilities we’ve used we’ve had to adjust the mic configuration during or after the first interview.
  • Research facilities do good lunches.
  • The observers should make their own notes around specific insights and themes, but don’t have everyone duplicating the notes that the note-taker makes – you’ll just end up with an unmanageable mountain of post-its.

More please

Lean UX BookWe plan to do much more of this as we continue to transform the NHS Choices service. As we move into an Alpha phase, we’ll continue to test what we’re building with users on a regular basis – we’ll probably switch from a one-week cycle to testing every fortnight.

As someone from more of a Software Development background, I find it fascinating to be able to get even closer to users than I have before, and start to really understand the context and needs of those people who we’ll be building the service for.

If you’re interested in reading more around some of the ideas in this post, try Lean UX – it’s a quick read, and talks in more detail about integrating User Research into an agile delivery cycle.

Lego Flow Game

We run regular Delivery Methodology sessions for a mixture of Delivery Managers and other folk involved in running Delivery Teams. It’s the beginning of a Community of Practice around how we deliver.

One of the items that someone added to our list for discussion recently was about how we forecast effort, in order to predict delivery dates. Straight away I was thinking about how we shouldn’t necessarily be forecasting effort, as this doesn’t account for all of the time when things spend blocked, or just not being worked on.

Instead we should be trying to forecast the flow of work.

We’d been through a lot of this before, but we have bunch of new people in the teams now, and it seemed like a good idea for a refresher. My colleague Chris Cheadle had spotted the Lego Flow Game, and we were both keen to put our Lego advent calendars to good use, so we decided to run this as an introduction to the different ways in which work can be batched and managed, and the effect that might then have on how the work flows.

Lego Advent Calendar

The Lego Flow Game was created by Karl Scotland and Sallyann Freudenberg, and you can read all of the details of how to run it on Karl’s page. It makes sense to look at how the game works before reading about how we got on.

We ran the game as described here, but Chris adapted Karl’s slides very slightly to reflect the roles and stages involved in our delivery stream, and he tweaked the analyst role slightly so they were working from a prioritised ‘programme plan’.

Boxes of Lego kits

Round 1 – Waterfall

Maybe we’re just really bad at building Lego, but we had to extend the time slightly to deliver anything at all in this first round! Extending the deadline, to meet a fixed scope, anyone?

The reason we only got two items into test and beyond was that the wrong kits were selected during the ‘Analysis’ phase for three items. The time we spent planning and analysing these items was essentially wasted effort, as we didn’t deliver them.

The pressure of dealing with a whole batch of work at that early stage took it’s toll. This is probably a fairly accurate reflection of trying to do a big up-front analysis under lots of pressure, and then paying the price later for not getting everything right.

It was also noticeable that because of the nature of the ‘waterfall rules’, people working on the later stages of delivery were sat idle for the majority of the round – what a waste!

Our Cumulative Flow Diagram (CFD) for the Waterfall Round looked like this –

Waterfall CFD

You can see how we only delivered two items, and these weren’t delivered until 7:00 – no early feedback from the market in this round!

CFDs are a really useful tool for monitoring workflow and showing progress. I tend to use a full CFD to examine the flow of work through a team and for spotting bottlenecks, and a trimmed down CFD without the intermediate stages (essentially a burn-up chart) for demonstrating and forecasting progress with the team and stakeholders.

You can read more about CFDs, and see loads of examples here.

Round 2 – Time-boxed

We did three three-minute time-boxes during this round. Before we started the first time-box we estimated we’d complete three items. We only completed one – our estimation sucked!

In the second time-box we estimated we’d deliver two items and managed to deliver two, just!

Before the third time-box we discussed some improvements and estimated that we’d deliver three again. We delivered two items – almost three!

Team members were busier in this round, as items were passed through as they were ready to be worked on.

Timeboxed CFD

The CFD looks a bit funny as I think we still rejected items that were incorrectly analysed (although Karl’s rules say we could pass rejected work back for improvement)

The first items were delivered after 3:00 and you can the regular delivery intervals at 6:00 and 9:00, typical of a time-boxed approach.

Round 3 – Flow

During the flow round, people retained their specialisms, but each team member was very quick to help out at other stages, in order to keep the work flowing as quickly as possible.

Initially, those working in the earlier stages took a little getting used to the idea of not building up queues, but we soon got the hang of it.

The limiting of WIP to a single item in each stage forced us to swarm onto the tricky items. Everyone was busier – it ‘felt faster’.

We’ve had some success with this in our actual delivery teams – the idea of Developers helping out with testing, in order to keep queue sizes down – but I must admit it’s sometimes tricky to get an entire team into the mindset of working outside their specialisms, ‘for the good of the flow’.

Here’s the CFD –

Flow CFD

The total items delivered was 7, which blows away the other rounds.

You can see we were delivering items into production as early as 2:00 into the round. So not only did we deliver more in total, but we got products to market much earlier. This is so useful in real life as we can be getting early feedback, which helps us to build even better products and services.

The fastest cycle time for an individual item was 2:00

A caveat

Delivering faster in the final round could be partly down to learning and practice – I know I was getting more familiar with building some of the Lego kits.

With this in mind, it would be interesting to run the session with a group who haven’t done it before, but doing the rounds in reverse order. Or maybe have multiple groups doing the rounds in different orders.

A completed Lego kit

What else did we learn

* Limiting WIP really does work. The challenge is to take that into a real setting where specialists are delivering real products.

* I’ve used other kanban simulation tools like the coin-flip game and GetKanban. This Lego Flow Game seemed to have enough complexity to make it realistic, but kept it simple enough to be able to focus on what we’re learning from the exercise.

* Identifying Lego pieces inside plastic tubs is harder than you’d think.


Overall a neat and fun exercise, to get the whole team thinking about how work flows, and how their work fits into the bigger picture of delivering a product.

But why no technical stories?

In my current workplace we’ve been using User Stories in various guises for a while now. One of the things that frequently crops up is whether these Stories can or should be technical or not?

To start with it may be useful to remind ourselves of some of the aspects of a user story…

A User Story describes something that a user needs to do, and the reason they need to do this. They are always written from a user’s point of view, so that they represent some value to the user, rather than a technical deliverable.

They represent the whowhat and why – an example might be –

As an expectant parent
I want to receive emails about parenting
So that I can read information about how to best care for my child

They are intentionally brief, so as to encourage further conversation, during which the needs of the user can be explored further, and potential solutions discussed. They are not intended to be detailed up-front specifications – the detail comes out of the conversations.

So who owns the User Stories?

User stories are designed to represent a user need. Most of the time these users are members of the public, but we don’t have our actual users in the office writing and prioritising stories, so we have a proxy for them instead – which we call the Product Lead (PL).

Part of the PL’s job is to represent what our users need – they use User Stories to capture these needs, ready for future discussion. So the PL owns the stories and their relative priority. If this is the case, then the PL needs to understand the stories, so that they can own them. If the backlog has technical stories in it, then it is difficult for them to prioritise these against other user needs.

For example, if the PL sees a story about enabling the public to search for GPs, and another story about reconfiguring a data access layer – they’re likely to prioritise the user-focussed story as they can see the tangible benefit. The technical work is totally valid, but it needs to be derived from a User Story – everything should start with a user need.

What if it’s an internal user?

As suggested above – most of the time the users we are capturing the needs of, are members of the public. Sometimes we use more specific personas in order to capture the needs of specific groups of people e.g. expectant parents

Other times, the users are our own internal users. We can still express their needs in terms of a user story –

As a data manager in the Data Workstream
I want to configure search results views
So that I can change the information displayed in accordance with DH policy

Here there is still an underlying need of the public, but the story is expressed from the point of view of the Data Manager. We could have just written down a technical story like –

Build a data configuration system for results views

but if we do this we have skipped a step. We have assumed that we know the single best solution straight away. Maybe there are other options to achieve their initial need – maybe if we stop to think about these other options we will find one that is cheaper/better/faster too.

When should we do technical design?

Although we need to some technical design up-front in order to set a general direction of travel, the detailed design work for a particular story should be done as close to actually implementing the story as possible.

In the past we have suffered from doing lots of detailed design of technical implementation well in advance of actually being ready to deliver that piece of work. Often by the time it came to deliver that piece of work our understanding had evolved and the up-front design was no longer valid.

Don’t try to do the technical design work when you first create the story. Wait until we are ready to deliver that story, and then look at the technical options available. By doing this work Just-In-Time we are much less likely to waste effort thinking about a solution that will never be delivered.

How do we track progress?

We track progress in terms of completed stories. If we keep those as User Stories then we are measuring our progress in terms of actual value delivered to our users.

If we break stories down into lots of technical stories then it may look like we are making lots of progress, and that we are very busy, but we could have delivered very little genuine value at the end of it all. If, for example we reported that –

“We’ve completed 90% of the business layer code”

that sounds very positive, but we could have delivered no actual working tested functionality for our users at this point. By keeping our stories user-focussed, our progress is also measured in terms of value delivered to users.

How do we get from User stories to technical scope

We’ve talked about how important it is to start with user needs, but ultimately we need to build something, so we have to get down to the technical detail at some point.

One way of ensuring that all scope maps back to an overall goal is to use a technique called Impact Mapping. We used this on a very technical project to ensure that all of the technical deliverables mapped back to an overall goal.

At the same time as deriving those initial stories, we’d usually be thinking about the overall technical approach. We’d look for answers to high-level questions around what technologies to use, and what approach to use. These wouldn’t be technical stories though – this would likely be documented in a lightweight high-level design document.

Story Decomposition and Technical Tasks

Once we’ve derived some initial user stories from our goal, we’d continue to break those stories down until we arrive at the technical scope.

User stories can be split into smaller stories but we always try to retain value to the user in each story, rather than making them technical.

For example, the story above about parenting emails might be split into smaller stories like –

As an expectant parent
I want to sign up for email notifications
So that I receive useful information about caring for my baby


As an expectant parent
I want my email address to be validated
So that it is clear when I have entered an invalid email address


As an expectant parent
I want to provide my first name when signing up
So that the emails I receive are personally addressed to me

Each of these stories is a smaller deliverable, but still makes sense from a user’s point of view.

Further to that, once we end up with nice small stories, we can create a list of technical tasks. Each story might contain the tasks needed to deliver that particular story. The tasks get down to the level of technical detail around what components and packages need to be altered, in order to deliver.

Ultimately – we will end up with technical pieces of work to do. Key is that all of these are derived from user needs.

* We don’t have to use User Stories for EVERYTHING

Okay, so we go on about User Stories a lot, but ultimately they’re just a tool for communication. A User Story represents some change we want to make in order to deliver some value. It’s a cue to go and have a further conversation about that piece of work, and that value.

If we can have these conversations, and deliver the value, without writing stories every time, then maybe that’s okay. The most important thing is for the people concerned to talk to each other frequently, deliver the work in really small chunks, and get feedback as often as possible.

User stories do really help us with this, but there might be occasions when they’re not the best tool…

Conclusions

Yes, we’re going to end up with stories that are technical in their implementation, but it’s important to not jump straight into that implementation. Think about our users, and their behaviours – and derive the stories from that.


Sizing, Estimation and Forecasting

The story so far

Over the last few years we’ve tried a variety of estimation and planning techniques. We’ve suffered from our fair share of Estimation Anti-patterns and tried various approaches to avoid these.

I thought it’d be useful to outline some of the approaches we’ve tried, the problems we’ve encountered, and how we’ve reacted to those in order to get to where we are now.

2010

Back in 2010 estimates were forced to fit a previously agreed plan:

“What’s the estimate”

“60 days”

“It needs to be 30, go away and re-estimate it”

This is a cross between the Target Estimation and Comedy-driven Estimation anti-patterns, and obviously it’s just a big farce – what’s the point in estimating in the first place if you’re just going to have a fixed time, scope and resource all imposed on you.

This approach led to teams and individuals being put under a great deal of pressure, and generated bad feeling between the people who imposed the ‘estimates’ and those who had to stick to them.

Of course corners were cut in order to meet the fixed estimates, which led to further technical debt, which just exacerbated the whole problem for future projects – the Done-driven estimation anti-pattern.

2011

During 2011 we gradually moved away from ‘fixed’ estimates. We introduced a few fairly standard ideas –

Estimating in ideal days

We started estimating in ideal days, to take into account of the fact that a Developer doesn’t get to spend their entire day dedicated to the estimated item that they’re currently working on.

This worked okay, once we finally hammered out the exact definition of an ideal day…

“Does an ideal day include meetings?”

“But what if the meeting relates to the story they’re working on?”

Having the people who are going to do the work doing the estimation

We tried to throw out the idea that a single individual could estimate a project more accurately and precisely than the developers who were familiar with the codebase, and who were about to do the work.

Estimates would still be questioned by people who weren’t going to do the work. We’d get Architects or Managers questioning why Developers thought something would take, for example, 3 days –

“That story’s just a few lines of code isn’t it”

This was frustrating, and we probably did waste more than a few hours justifying estimates to people outside the team.

Planning poker to derive estimates from the group, not individuals

The introduction of planning poker was quite good fun to start with. It bought the team together and helped to alleviate some of the discussions and justification that we had to go through.

Planning Poker Cards

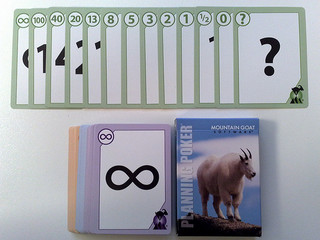
However, it sometimes did feel like a bit like a negotiation – with some people deliberately going in low to try to bring an estimate down.

Velocity – planning based on past performance

We introduced the standard idea of velocity from Scrum –

Take the number of ideal days you complete in an iteration, and then plan your next iterations based on that.

This was sound, but unfortunately it was described by whoever sold the concept to senior management as being a percentage measure. So if a team got 30 ideal days of stories completed in an iteration of 40 elapsed developer-days, the team had achieved a ‘75% velocity’ – this was really ugly, and came to hurt us, as you’ll read below.

We struggled a bit with the idea of the team committing to a sprint goal. There were a lot of dependencies on other teams that we just didn’t account for, so we could never really meet what felt like reasonable goals.

Relative Estimates

Paint Roller

We started to estimate work based on it’s relative size, compared to work we’d done previously. After all, this seemed like the quickest and generally most reliable way to estimate. If you ask a decorator to quote for painting a room, they can usually give you a rough quote without measuring up, because they’ve already painted lots of rooms of roughly the same size before.

This approach for us was pretty successful – if we’d tackled a similar size project in the same product area, we could look up the actual effort we expended on the previous project and use that to guide our estimate for the new project. When the newer project was complete, looking at the actuals showed us that this was a fairly accurate method.

It helped us to resolve the Fractal Estimation anti-pattern that we’d suffered from in the past, because we were now looking at sizing the project as a whole to start with, as opposed to trying to break it up and estimate each constituent part.

The problem was when we had to estimate something that wasn’t really similar to anything we’d built before.

Overall things improved during 2011 – the people doing the work had more control, and we had a method by which to size things, and plan work. But then things started to unravel…

2012

It gradually became clear that some of the things that we thought were working, weren’t really…

Story Points

The business didn’t understand the concept of Ideal days, so we re-branded them as Story Points, where a story point equates to an ideal day. This didn’t really help though as we never built a shared understanding that Story Points are a relative measure of size, as opposed to an exact measure of time taken to do something.

“How big is the project?”

“30 points”

“You have five developers, so it’ll be done in six days?”

“Erm…maybe…”

What’s velocity?

The concept of Velocity was never been well understood by the business either. It became seen as a measure of efficiency, or utilisation. To paraphrase:

Managing Director: “What’s velocity?”

Programme Manager: “It’s the time that developers aren’t working – like when they go for lunch or a p*ss”

and so the percentage thing came back to bite us – velocity was used as a stick to beat the teams with –

“The Developers are only working at 60%, we need to get them to work at 70%”

Targets

Archery TargetWe moved away from planning based on past performance and trying to improve on that, to planning based on fixed targets per developer. The Target Estimation anti-pattern again.

To increase speed; targets were set for developers to develop a certain amount of work each week.

The planning was based on one big resource pool of developers (only), with individual targets aggregating up into one giant target.

The focus was on individual developer productivity rather than actual throughput of developed and tested stories. This led to a bad working environment, much frustration, and undesirable behaviours.

Some teams adopted the Velocity-driven estimation anti-pattern in order to get around the targets they were set. But it didn’t mean they were delivering any more work – it just meant that Story Points became even more meaningless…

Budgets

A positive thing we introduced in 2012 was the idea of budgets for pieces of work. This was the starting point for turning the question around and establishing what each piece of work is worth to the business –

“How long will this project take you?”

“We’re not sure yet. How long would you like us to spend working on it?”

Developers-only

As you’ll have picked up from the story so far – the vast majority of the focus was on Developers, and only Developers. They were widely regarded as the limiting ‘golden’ resource, and as such theirs was the only work that needed estimating – everything else that needed to be done like story-writing, deployment and testing would just fall into place.

This is partly the Done-done-driven Estimation anti-pattern. The problem with focussing on just Developers is that they cannot deliver work in isolation. There are many inter-dependencies on other roles such as BAs, EAs, Testers, Infrastructure, DBAs and so on.

It is the team that delivers work, not individuals. You can try to estimate the effort that a Developer alone will have to put in to deliver a story, but that really is only a part of the work needed to deliver end-to-end.

2013

As part of the more focussed agile transformation process, we decided to have a complete re-think about how we estimate and plan at the team-level.

Principles

We came up with some principles by which we wanted to base our estimation and planning. These are based on the experience of the team, and tied in with the feedback that we received from some external consultants  we were working with.

  • Plan based on past performance
  • Track the whole cycle, not just development
  • Estimates are not exact quotes
  • Plan at a team level and scale up, not the other way around
  • Limit work in progress
  • Separate the methodologies used for planning, from that used for performance management

What matters

We considered having another crack at using story point estimation and velocity as it was intended, but decided that there were already too many misconceptions around this for it to be a success.

Instead we opted to try some of the more empirical techniques associated with Kanban, which tied in nicely with our move away from iterations to more of a flow-based delivery model.

The beauty of these techniques is that they focus on what matters – the question that our colleagues and management want an answer to is generally

“When will we get this product?”

not

“How much effort will it take?”

We started focussing on the elapsed time that it took to deliver things, as opposed to how much effort a particular role puts in to get it there.

Efficiency

An eye-opening aspect of this is to look at Business Process Efficiency (BPE) – which is the ratio of the time that a piece of work is actively being worked on (by anyone), to the total time that it takes to deliver that piece of work.

Many organisation are working with a typical BPE of just 15%. So for the vast majority of the time it takes to deliver something, that thing is just sat waiting to be worked on – perhaps at a handover between roles or teams. So all the work we put in to estimate effort was really only focussed on a very small portion of the time it takes to deliver – and focussing on developers only magnified this even more!

The here and now

Flow and Forecasting

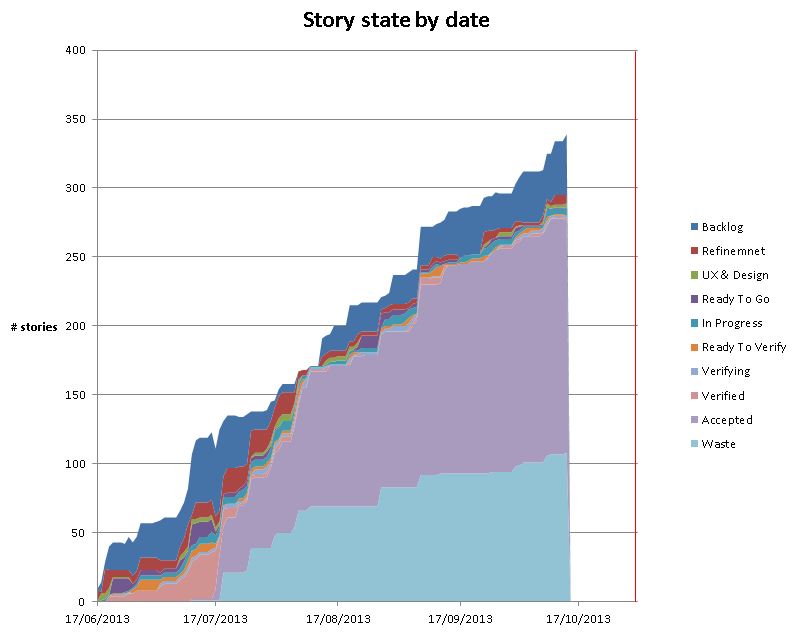
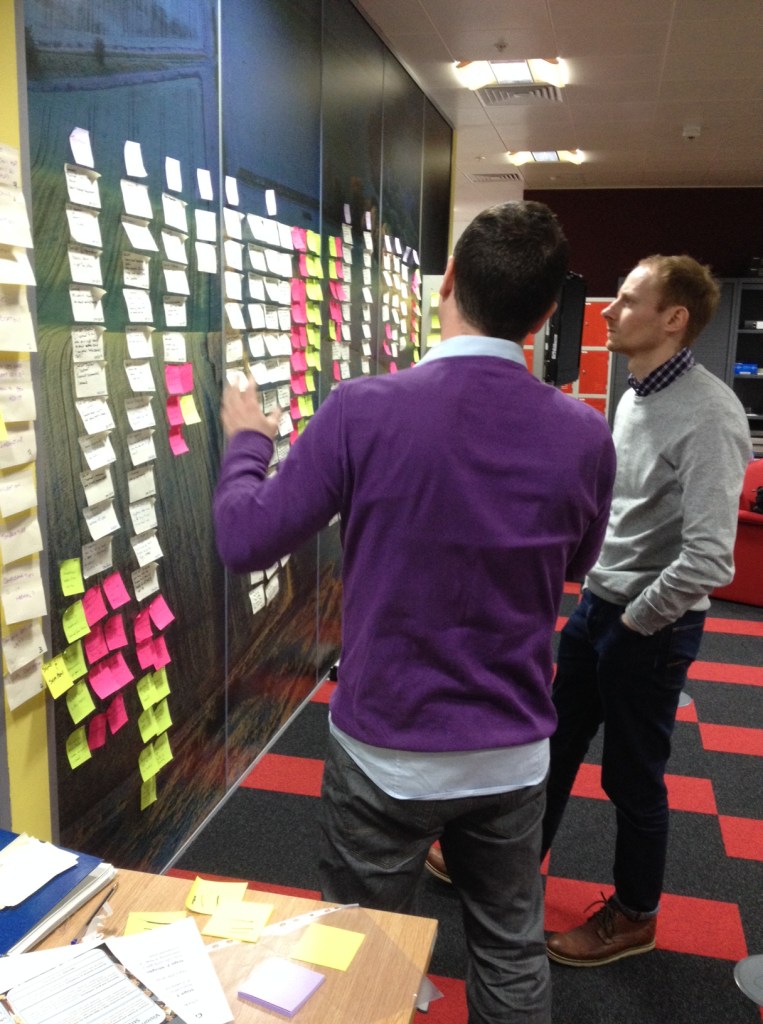
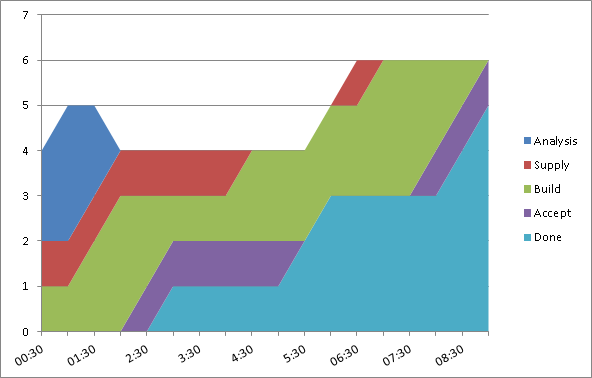
Where we are now is that the teams aim to split stories up nice and small. They then count the number of stories in each state of their kanban system each day. We use this to track each teams’ flow.

We generate Cumulative Flow Diagrams (CFD) and record team throughput. Both of these can be used to forecast future delivery. The great part is that this is not based on anyone’s judgement of the size of a piece of work – it is based on the actual empirical figures for how long it takes to deliver.

CFD

Cycle Time

We track the Cycle Time for stories – this is the time it takes to deliver a story end-to-end. It is currently surprisingly high, and we’re challenging teams to see what they can do to reduce their cycle times – the quickest win for this is to reduce the time that stories sit in a particular state waiting for someone to pull them into the next. We can improve on this by limiting the number of things that we work on at any one time.

Sizing

When we set out with this method of using empirical data to forecast, instead of estimating, we were concerned about the disparity in the size of stories. If we’re just counting stories what would happen if we delivered all of the smaller stories first, and were left with all the bigger ones – it’d look like we were way further head than we really were.

To counter this we sized stories small, medium or large. We had one person per team doing this to generate some consistency, and it was a quick process that was done as part of the story’s refinement.

We then tracked CFDs for both story count, and a kind of ‘weighted count’ that took the relative size into account e.g. a medium is twice a small, and a large is twice a medium.

So this took differences in story size into account, but what we found was that over time the slope of the CFD’s accepted state was roughly the same for the weighted and non-weighted count. A forecast based on story count alone should be as accurate as the forecast that takes story size into account.

For this reason, we’ve stopped sizing altogether and now just count stories. What’s key is that we aim to get a reasonable consistency of small stories.

Time-boxes

Back when we introduced budgets we started to turn around the question of how long something would take, to how long did the business want us to spend on it – what is it worth?

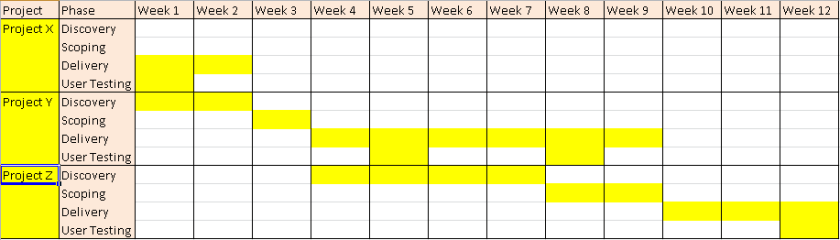
We’ve extended this to reinforce the idea of fixing time and flexing scope, by planning time-boxes. A project has an assigned delivery time-box during which the team pull stories from the backlog for that project. Once that time-box is over the team finish any unfinished stories off, but start pulling new stories from the next project time-box to which they’re assigned. Essentially the time-box controls which project the team pull new stories from – or in Kanban terms – where they replenish their system from.

plan

Project cycle-time

The question that remains is what is a reasonable length of time-box to plan in for a project.

At a higher-level what we need to do next is start tracking the cycle time of overall projects. We can then use this to plan sensible time-boxes for delivery of future projects of a similar nature.

The Future

It’s been a long and sometimes frustrating journey – but it feels like we are now in a better place. We now spend a lot less time sizing and estimating things – practically none in fact.

In future we aim to widen the gathering of metrics look for further patterns to see what impacts on delivery. There are still challenges ahead as we embark on newer, bigger pieces of work, but I think we are better equipped to give honest, accurate forecasts of what can be delivered, and by when.


PS. If you’d asked me to estimate how long it’d take me to write this blog post I’d have said a couple of days. It took a bit longer…


photo credit: lemonad via photopin cc

photo credit: eatmorechips cc

photo credit: bensutherland cc

What does a Product Lead do?

The Product Lead (PL) role has existed in our organisation for some time. On the face of it, the role is broadly comparable to the Product Owner (PO) role, as described by the Scrum​ agile methodology – some of the responsibilities match up.

The main difference is that the PO role is generally regarded as a full-time role working very closely with the delivery team, whereas our PLs are almost always individuals who have other full-time roles within their respective workstreams.

This poses problems, and creates frustration, as we have competing priorities for our PLs’ time. We could try to enforce the traditional PO role, but really it is for us as an organisation to define our roles, and what they do.

In an attempt to clarify the role, we wrote this guide for our Product Leads, around the things that we expect them to do –


Vision and Goal

You’ll be outlining the vision for the product or feature, and explaining the overall goal. Ideally this goal would be measurable. If you’re not sure what the overall goal is, try asking yourself ‘Why?’ until you reach the real value – see The 5 Whys

Detail

You’ll work with the delivery team to help define the features we’re going to build. We do this through User Stories and their Acceptance Criteria​. The best way to do this is to provide us with specific examples – lots of them.
e.g. How should it behave when we do this? What should users be able to do in this scenario?
We have BAs to help with this, but you need to own the backlog of User Stories that will be built.

Value and ROI

You’ll need to justify your product, in order to obtain a project budget. Once we start working on your product or feature, you’re responsible for guiding the team to build the right thing, that delivers value and meets the goal you’ve defined. Any information you can provide on what impact or benefit the product has had once it’s been released is useful too.

Prioritise

As we’re working within a limited project budget, its important that we build things in the right order. We don’t want to use the budget up working on non-critical features. The best way to present priorities is a numbered list in priority order. You own the prioritisation, and you can decide what we should build next, as we learn more about what our users need.

Verification

We need you to get involved in verifying that we’ve built the right thing, as early as possible. The testing doesn’t all wait until the end any more. We can provide you with a link so that you can see your product growing in a test environment on a daily basis. The more closely involved you are with verifying the product, the better you will be able to prioritise future work, and shape the product.

Feedback

We love feedback! Especially from real users. It’s what enables us to build better products. The weekly review is a great opportunity to provide feedback on what is being built.

Meetings

We have a number of meetings during the development of your product. First of all you’ll need to work regularly with BAs, Architects and UX Designers in coming up with some early ideas and design work. Once the development and testing work kicks off we have daily stand-ups, weekly Reviews and Planning sessions, and Retrospectives​ where we look at how things are going. You need to be involved in as much of this as possible.

Team

Whilst your product is being designed and built, we’d like you to be part of the Delivery Team. We know you all have busy jobs to do, but the best deliveries happen when the Product Lead gets closely involved.

Proxy

You must represent other stakeholders in the business, including your Managers. Make sure you manage their expectations, and let them know about any decisions that are being made, as early as possible. You are the main line of communication between stakeholders and the team delivering the product.

Documentation

You’ll need to update the documentation for your product in our Product Wikis. This involves creating and updating wiki pages so that the relevant people across the organisation understand, and can support, your new product or feature.

Impact Mapping on ODS

Impact Mapping is a technique for deriving scope from goals. It’s useful for looking at different options for meeting a particular measurable goal.

I’d been keen to tryimpact-mapping-cover it out since picking up a copy of Gojko’s book on the subject at BDDX2012. I don’t think we’ve used it ‘end-to-end’ yet – to truly evaluate and measure different options – but I have found it really useful in deriving scope and ensuring that scope maps back to an original goal.

A good example of where we used Impact Mapping to derive User Stories on a very technical project was the ODS migration project. Due to the restructure of the NHS – removal of SHAs and PCTs, and introduction of CCGs and ATs – we had to do some work in order to reflect this structure to the public.

This involved extensive changes to multiple ETL packages, and changes to the code to generate organisation profiles. We could easily have dived straight in to the technical detail and decided which ETL packages to change.

Instead we went through an exercise to ensure that all of the technical work we were to undertake was mapped right back to the overall goal.

1. Goal

Firstly we established the overall goal that we’re working towards. In this case the goal is for the nhs.uk site to accurately reflect the new NHS organisation structure.

Normally with this technique we’d want the goal to be measurable – like an increase in profit of 5%, or an increase of 10000 subscribers. In this case the goal is effectively binary – either the site does reflect the new structure, or it doesn’t…

ODS-Impact-Map-Goal

This is the cell at the centre of the map.

* In hindsight maybe we could have been more rigorous with the goal and measured it by surveying site visitors as to their understanding of the new structures. This may have been a better measure of the true overall goal – which is to communicate the new structure.

2. Actors

Next we went through an exercise of mapping out the different users, or actors associated with the goal of reflecting the new NHS structure, for example –

  • The external organisations who provide data feeds into nhs.uk – ODS, PPD, EDOS, PCIS
  • Organisation profile content managers
  • The general public themselves, as they are going to view the new organisation profiles on the site.

ODS-Impact-Map-Actors

The actors are represented by the pink cells surrounding the goal. ‘Big Shots’ is a role that my colleague Ashish came up with – the senior stakeholders who use the accountability views in our ‘Find & Compare’ product.

In future I’d like to identify more specific roles, and possibly tie them in with the personas that our UX team use.

3. Impacts

After identifying these different roles, we looked at the different ways in which they contribute to reflecting the new NHS structure, or how their behaviour will change as a result of the new structures. What are the impacts we want to have on the actors, or the impacts that we need the actors to make.

ODS-Impact-Map-Impacts

The blue cells represent the impact. The map really starts to expand at this point as some roles can do many things to bring us towards our goal.

4. Scope

Once we’d identified all of these behaviours we could then start to derive the scope required to enable that behaviour to occur.

So for example – ODS provide a nightly feed of the new NHS organisations, this is how they contribute to our goal of reflecting the new NHS structure. The work we need to do to enable that is to create a series of nightly import and data-synchronisation processes.

These can be derived as a series of user stories – something like

In order that nhs.uk can reflect the new NHS organisational structure
ODS can provide a nightly feed of CCG data

Each story is represented by a green cell. The overall map looks like this –

Impact-Map

Some of these stories were high-level and were then broken down further – we just added another level of nesting of green cells to represent this break-down.

Visualising the backlog

I’ve found the map a really useful alternative way of presenting the product backlog for a particular project or piece of work.

Since we started using User Stories to represent requirements, some have commented that in doing so we lose sight of the bigger picture.

One thing a colleague mentioned the other day is that User Stories are like leaves on a tree, but when we put them into the backlog it’s like stuffing all the leaves into a bin bag – making it pretty difficult to maintain any context between them.

Now with our Impact Map we’ve re-formed the tree with the leaves in place. We can stick our map up on the wall, and cross items off as they’re completed, or make notes against them.

Living Document

We had a good stab at capturing the necessary scope up-front, but naturally things emerged as we progressed with the work. Having this Impact Map meant that we could always check where suggested scope fitted into the big picture – how did it help us get towards our goal.

“Does it help us meet the goal?”

Some technical work was suggested around changing the mechanism by which we import certain data feeds, but when we examined it in the context of the map, it turned out we didn’t really need to do it. If we had jumped straight into the technical work without looking at the users, their needs and impacts, we would have wasted time doing this unnecessary work.

Tracking

I was acting as BA on this project, and I personally found the map a really useful way of tracking scope, progress towards our goal, and what our priorities were. The map itself was useful during planning, prioritisation and design sessions, as we had  a visual representation of the scope in front of us.

Each green ‘scope’ cell was set up to link to our work tracking system, and it was easy to visually represent progress on the map by ticking off or shading the completed stories. This showed how much closer we were getting to our overall goal.

The map was also used to show up blockers and dependencies in scope. We used icons in Freemind to indicate key questions and blockers that arose during delivery.

Tools

For the map described in this post I used FreeMind. Once you have a few keyboard short-cuts set up it’s quick to colour-code the cells and add icons and hyperlinks in.

I also tried out a MindMup version too.

Next steps…

The big thing I felt was missing from this first attempt at Impact Mapping was making the goal measurable. When I first created the map I didn’t think there was much in the way of metrics that we could use to measure our progress towards the goal – there’s certainly not a monetary value from our point of view. We could look at measuring the amount of traffic that certain areas of the site receive before and after implementation, and we could measure the number of service desk calls we receive in relation to the NHS structural changes.

This is something we need to work on – tying the features we deliver back to explicit, measurable goals. I think it really helps the whole delivery team understand what we’re aiming for, and if we can keep our options open for meeting that goal, and measure our progress towards it, then all the better.

We’ll keep refining our use of this technique on further product developments. We’ll push to get the Impact Map created as early on as possible, when we’re still figuring out the overall goal.

Delivery, Delivery, Delivery

When I started this job it was towards the end of a big release. I witnessed a long and painful bug-fixing period, and got to thinking about what improvements could be put in place to make the next release smoother. It soon became apparent though, that the releases all year had been late, and as such a backlog of work had built up. What also became apparent was that all of this work was contractually required to be delivered by the end of 2010. My first full release was certainly going to be interesting, if not smooth…

According to the PMs all of the required work would fit into the time we had, but unfortunately the estimates that this assertion was based on had all been provided by individuals who would not actually deliver the work, or by developers who had been forced to ‘estimate’ to a specific figure. In my mind these so-called estimates are pretty worthless, as the whole point of estimating is to be able to plan well (in many environments it’s also to cost things up, but in our case the costs are already fixed by the overall contract), but more on estimation in a future post…

So we ended up in a situation with the resource, time and scope were effectively fixed – not ideal.

We mitigated this to a degree by ensuring we worked on the right things first. Although the overall scope was fixed, there are usually ‘nice-to-have’ features that the business can truly live without. The business owners weren’t used to having to prioritise in this way – we had to gain their trust, and explain that we weren’t planning to drop their features, rather we needed to avoid a situation where if the sh*t really did hit the fan, we wouldn’t be left with critical features not implemented, based on their advice. This seemed to work okay, and we had more confidence that we were working on the right things in the right order. We also tightened the testing feedback loop by getting the testers to test everything in an earlier environment. This reduced the total cycle time to deliver bug-fixed requirements.

Even after those minor improvements, it was a tough release. The team worked a lot of overtime, something I hope to avoid in future. We worked late nights and we worked from home some weekends. When we worked in the office at the weekend we had to get portable heaters in as it was so cold that our fingers were seizing up, and when it really started snowing we booked people into hotels so they could carry on working instead of leaving early.

And we delivered. We got the release out on time, and we partied when it was all over. Would I want to do another release like that again – no way… However there was something positive about the team pulling together to beat the odds. It was a time when we worked hard and played hard together, and it’s still one of the releases that some of those involved talk about with a wry smile.

Introducing Iterations

New year, new start… We’ve just got a big release under our belts and it feels like there is now enough trust from senior management to start making a few changes to the way we do things.

So what first..?

One problem seems to be the feedback loop from the business. They come up with an idea, it spends a few weeks/months being spec’d up, and then we develop it. Finally it gets tested and eventually the business owner gets to see the ‘finished’ product…

This sounds okay in practice, but it doesn’t work because things change along the way.

We need to tighten the feedback loop so the business are involved and engaged throughout the whole of the design, develop, and testing process.

Another problem is that time is wasted in spec’ing up features that never get delivered because we then run out of time in the development phase.

Ultimately we need to move away from the long phase-based waterfall approach that makes the flawed assumption that we can get everything right and complete in one phase before moving onto the next.

Pull?

I think the ideal solution to this will be to introduce a pull-based continuous-flow pipeline type of approach. We’d take one minimal marketable feature at a time and deliver it all the way through the pipeline from start to finish.

Although this type of Kanban approach says ‘start with what you do now’ – I see us having the problem that this is going to require a lot of regular communication and engagement between different teams, who work in different geographical locations. The organisation isn’t currently used to this level and style of communication.

Iterate

After some thought, I reckon it’s probably going to be better to try an iterative approach first.

We’ll try working in two week iterations; taking a small chunk of work at a time – maybe a couple of features – developing and testing them, and then finally demo’ing them to the business owners to get approval that we’ve done the right thing, and/or feedback that we need to change things.

By getting this early and regular feedback we should avoid the nasty surprise of finding we’ve delivered something incorrectly right at the end of a release when we don’t have the time to do anything about it. Ideally if something is going to fail, we want it to fail as early as possible! We can tackle high priority and high risk items in the earlier iterations, to drive out risk, and ensure we’re delivering the core requirements early on.

My reasoning of choosing iterations over continuous flow, is that because of our split site, it will be good to have specific markers in time where the different teams can come together to look at where we are, review progress and then plan the next steps to take.

I actually hope that over time the iterations might naturally disappear and we’ll end up with the continuous flow system that will work even better in the long run. Until then I think that introducing the discipline required to make an iterative approach work, will be a good thing…